Factors Affecting an Endowment Fund's Purchasing Power
The maintenance of endowment purchasing power is affected by four major factors: a) fund investment return, b) fund expenses, c) the rate of inflation, and d) fund distributions. In general, endowments attempt to preserve endowment purchasing power by distributing no more than the average expected annual investment return after expenses and inflation.
a) Fund Investment Return
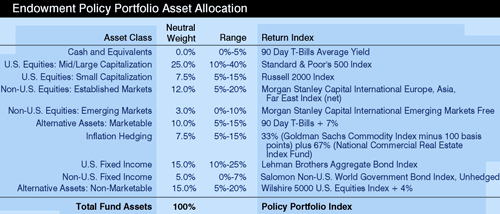
The investment returns and accompanying risk generated by the endowment funds are determined primarily by the allocation of fund assets to different classes of investments. The Endowment Policy Portfolio return is the index or benchmark return for the endowment funds. This return is the sum of the weighted benchmark returns for each asset class comprising the Endowment Policy Portfolio. The target asset mix of the Endowment Policy Portfolio is indicated in the following table:

Click to print charts in this section using PDF format
For fiscal year 2002 the Endowment Policy Portfolio posted a negative return of 6.57%. The expected average annual return of the Endowment Policy Portfolio was 9.35% with an associated expected risk of 10.44% (as measured by standard deviation). This means that we expect actual returns to be within the range of (1.09)% to 19.79%, in two out of three years. Unfortunately, fiscal year 2002 endowment fund returns were outside the policy range, posting negative returns as follows:
| Permanent University Fund | (7.35)% |
| General Endowment Fund | (6.96)% |
| Permanent Health Fund | (7.05)% |
| Long Term Fund | (6.97)% |
| Endowment Policy Portfolio | (6.57)% |
The actual average annual investment return of the current Endowment Policy Portfolio
over the last 10 fiscal years was 10.34%, and was quite volatile as presented below:
b) Fund Expenses
The endowment funds incur expenses associated with strategy and analysis, portfolio management, custody and safekeeping, accounting, and other investment related functions. These expenses are allocated to the endowment funds in proportion to their asset values and certain activity levels. Fund expenses are paid from fund assets and are not netted against the distributions.
c) Rate of Inflation
Inflation erodes the value of endowment funds by reducing fund purchasing power over time. Investors have no control over the rate of inflation. UTIMCO must invest fund assets so as to maximize the risk adjusted real return on investment. Inflation is cyclical, resulting in periods of increasing and decreasing fund purchasing power. The long-term average annual rate of inflation since 1926 is approximately 3.2% with a range of (10.3%) to 18.1%.
d) Fund Distributions (Spending)
Annual distribution, or spending, from endowment funds (except for the Separately Invested Funds) is controlled by a spending policy approved by the UT Board of Regents. The key to preservation of endowment purchasing power over the long-term is control of spending through a target distribution rate. This target rate should not exceed the endowment's average annual investment return after fund expenses and inflation. The Long Term Fund and Permanent Health Fund distributions are increased annually at an average rate of inflation provided that the distribution rate remains within a range of 3.5% to 5.5% of fund asset value. Annual Permanent University Fund distributions to the Available University Fund are currently based on 4.75% of the Permanent University Fund's twelve quarter average net investment value.
Actual investment returns for any given year may vary significantly from the expected average annual investment return. Therefore, the endowment distribution policies use a smoothing formula to reduce annual volatility in spending and to maintain spending on a sustainable basis. The historical distribution rates for the Permanent University Fund and Long Term Fund are presented below:
Combining these
four factors, the higher the fund investment return and the lower the rates of
fund expenses, inflation, and spending, the greater the ability to increase the
purchasing power of the endowment assets and the spending stream over time.
Looking ahead, because of reduced return expectations across all asset classes
over the next five to seven years, it may be quite difficult to meet current needs
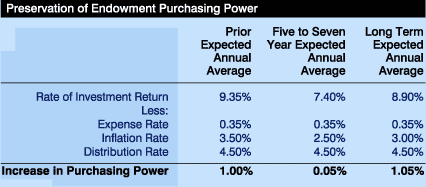
and continue to build purchasing power. The chart below compares UTIMCO's expected
five to seven year annual average returns for the Endowment Policy Portfolio with
the prior forecasts and with a new longer term forecast for the next thirty years.

Click to print charts in this section using PDF format
next >>

