Distributions
10. What is the spending (distribution) policy of the LTF?
The LTF utilizes what is often called a "constant growth" spending policy in determining annual distributions. Under a constant growth spending policy, distributions in a year are equal to the distribution in the prior year (in dollars) plus an increase to offset actual inflation in that particular year. Thus, distributions grow at a steady rate equal to the rate of inflation, which provides a stable stream of "real" resources to the beneficiaries of the endowments in the LTF. The constant growth spending policy is particularly suited to endowments in which current distributions are large relative to the total budget for the program being served by the endowment, as is the case for many of the endowments in the LTF. An unfortunate effect of the constant growth spending policy is that the volatility of financial markets, which is typically much greater than the volatility of inflation, is transferred to the value of the endowment funds from which distributions are made. To moderate potential negative effects on the value of endowments, which could endanger the ability of the endowments to meet the needs of future beneficiaries, a smoothing formula is used to calculate the inflation rate at which distributions are increased year to year and limits are placed on the distributions to protect the endowments under the most adverse capital market environments.
11. How is the distribution rate determined?
Distributions are increased annually at the three year average rate of inflation, provided that the distributions remain within a range of 3.5% and 5.5% of the three year average net asset value of the LTF. All calculations are done on a per-share (or per-unit) basis, to adjust for flows into and out of the LTF. For example, the 2008 distribution rate of $.2929 per unit was increased to $.3024 for fiscal year 2009 because the average three year increase of the consumer price index was 3.2%. Distributions based on the new rate of $.3024 were equal to 4.25% of the three year per-unit asset value of the LTF, within the allowable range of 3.5% to 5.5%, up from the 4.00% payout in 2008. The long-term target distribution rate for the LTF is 4.75%.
12. Who determines the distribution rate for the LTF?
Final authority over the distribution rate rests with the UT System Board of Regents. Following the Spending Policy established by the UTIMCO Board, UTIMCO staff recommends the annual distribution rate to the UTIMCO Board of Directors. Upon approval by the UTIMCO Board, the rate is recommended to the UT System Board of Regents.
13. What is the current payout of the LTF?
The payout for the LTF for the fiscal year ended August 31, 2008, was $.2929 per unit. The UT System Board of Regents has approved a payout rate of $.3024 per unit for the fiscal year ending August 31, 2009. The 2008 payout or distribution rate amounted to 4.00% of the LTF's twelve-quarter average net asset value.
14. How does the distribution rate convert into dollars distributed to the individual endowment beneficiary?
All endowments which invest in the LTF purchase units based on the LTF's market value per unit as of the date of purchase. The endowment beneficiary receives distributions on the last day of each fiscal quarter from the LTF based on the number of units owned at that time multiplied by the current distribution rate.
15. How has the distribution policy in the past affected the internal growth of the LTF?
The LTF's investment and distribution policy has been positioned to balance the needs of present and future beneficiaries by distributing only a portion of the market value of the endowment each year. For the five and ten year periods ended August 31, 2008, the LTF's distribution rate has averaged 4.38% and 4.51% of trailing three year average net assets, respectively, while the average annual total return for the same time periods have been 11.11% and 9.07%, respectively. Consequently, reinvested earnings, the difference between the total returns and the distribution rates over the time periods, provide the cushion to support the endowments' educational programs in the future, while still meeting the needs of current beneficiaries.
UTIMCO adheres to the constant growth distribution philosophy. Distributions rates are targeted at 4.50% to 4.75%. In years when investment markets are strong, excess returns are held within the LTF. In years, such as fiscal year 2008, when investment returns fall below the targeted distribution rate, these amounts are used to maintain a constant distribution stream for beneficiaries.
16. What effect does the target spending (distribution) rate have on an endowment's value in the long term?
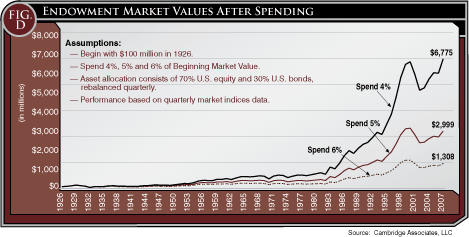
One of the two objectives required to preserve the purchasing power of the endowment is to increase the market value of the endowment (after the annual distribution) at a rate at least equal to the rate of inflation. Over the long term, a higher spending rate will produce a lower long term endowment market value when compared to a lower spending rate. The effect that the distribution (spending) rate will have on the endowment's value is shown graphically in Figure D.

Click to print charts in this section using PDF format
17. What effect does the target distribution (spending) rate have on the amount of the distribution (the dollar payout) paid to the endowment beneficiaries in the long term?
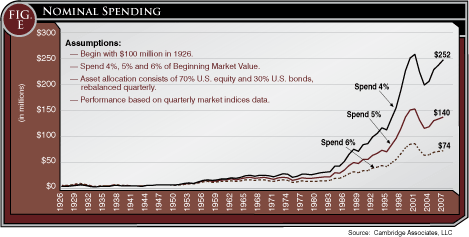
One of the two objectives required to preserve the purchasing power of the endowment is to increase the amount of the annual distribution to endowment beneficiaries at a rate at least equal to the rate of inflation. Over the long term, a higher spending rate will produce a lower spending amount because the endowment's ability to grow has been compromised by the higher spending rate. The effect the distribution (spending) rate has on the dollar payout is shown graphically in Figure E.

Click to print charts in this section using PDF format
18. How does the current distribution rate of the LTF compare to other colleges and universities?
The LTF's distributions, when compared to the 2007 NACUBO Endowment Study, are near the distribution rates for large endowment funds (Figure F).

Click to print charts in this section using PDF format