Frequently Asked Questions
LTF DISTRIBUTIONS
1. What is the spending (distribution) policy of the LTF?
The LTF utilizes what is often called a �constant growth� spending policy in determining annual distributions. Under a constant growth spending policy, distributions in a year are equal to the distribution in the prior year (in dollars) plus an increase to offset actual inflation in that particular year. Thus, distributions grow at a steady rate equal to the rate of inflation, which provides a stable stream of �real� resources to the beneficiaries of the endowments in the LTF. The constant growth spending policy is particularly suited to endowments in which current distributions are large relative to the total budget for the program being served by the endowment, as is the case for many of the endowments in the LTF. An unfortunate effect of the constant growth spending policy is that the volatility of financial markets, which is typically much greater than the volatility of inflation, is transferred to the value of the endowment funds from which distributions are made. To moderate potential negative effects on the value of endowments, which could endanger the ability of the endowments to meet the needs of future beneficiaries, a smoothing formula is used to calculate the inflation rate at which distributions are increased year to year and limits are placed on the distributions to protect the endowments under the most adverse capital market environments.
2. How is the LTF distribution rate determined?
Distributions are increased annually at the three year average rate of inflation, provided that the distributions remain within a range of 3.5% and 5.5% of the three year average net asset value of the LTF. All calculations are done on a per-share (or per-unit) basis, to adjust for flows into and out of the LTF. For example, the 2011 distribution rate of $.3172 per unit was increased to $.3215 for fiscal year 2012 because the average three year increase of the consumer price index was 1.4%. Distributions based on the new rate of $.3215 were equal to 5.33% of the three year per-unit asset value of the LTF, within the allowable range of 3.5% to 5.5%, up from the 5.05% payout in 2011. The long-term target distribution rate for the LTF is 4.75%.
3. Who determines the distribution rate for the LTF?
Final authority over the distribution rate rests with the UT Board. Following the Spending Policy established by the UTIMCO Board, UTIMCO staff recommends the annual distribution rate to the UTIMCO Board. Upon approval by the UTIMCO Board, the rate is recommended to the UT Board.
4. What is the current payout of the LTF?
The payout for the LTF for the fiscal year ended August 31, 2011, was $.3172 per unit. The UT Board has approved a payout rate of $.3215 per unit for the fiscal year ending August 31, 2012. The 2011 payout or distribution rate amounted to 5.12% of the LTF�s twelve-quarter average net asset value.
5. How does the distribution rate convert into dollars distributed to the individual endowment beneficiary?
All endowments which invest in the LTF purchase units based on the LTF�s market value per unit as of the date of purchase. The endowment beneficiary receives distributions on the last day of each fiscal quarter from the LTF based on the number of units owned at that time multiplied by the current distribution rate.
6. How has the distribution policy in the past affected the internal growth of the LTF?
The LTF�s investment and distribution policy has been positioned to balance the needs of present and future beneficiaries by distributing only a portion of the market value of the endowment each year. Reinvested earnings, the difference between the total returns and the distribution rates over time, provide the cushion to support the endowments� educational programs in the future, while still meeting the needs of current beneficiaries.
UTIMCO adheres to the constant growth distribution philosophy. Distributions rates are targeted at 4.75%. In years when investment markets are strong, excess returns are held within the LTF. These excess returns are used to maintain a constant distribution stream for beneficiaries in years, such as fiscal years 2008 and 2009, when investment returns fell below the targeted distribution rate.
7. What effect does the target distribution (spending) rate have on an endowment's value in the long term?
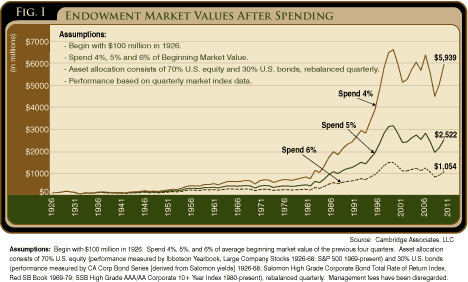
One of the two objectives required to preserve the purchasing power of the endowment is to increase the market value of the endowment (after the annual distribution) at a rate at least equal to the rate of inflation. Over the long term, a higher spending rate will produce a lower long term endowment market value when compared to a lower spending rate. The effect that the distribution (spending) rate will have on the endowment�s value is shown graphically in Figure I.

Click to print charts in this section using PDF format
8. How does the current distribution rate of the LTF compare to other colleges and universities?
The LTF�s distributions, when compared to the 2010 NACUBO-Commonfund Study of Endowments, are near the distribution rates for large endowment funds (Figure J).

Click to print charts in this section using PDF format
9. What effect does the target distribution (spending) rate have on the amount of the distribution (the dollar payout) paid to the endowment beneficiaries in the long term?
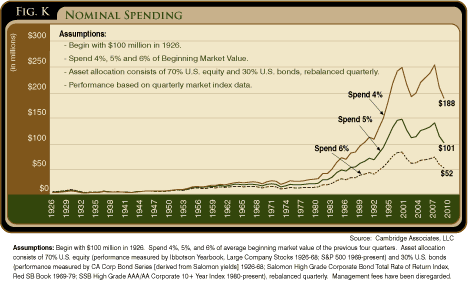
One of the two objectives required to preserve the purchasing power of the endowment is to increase the amount of the annual distribution to endowment beneficiaries at a rate at least equal to the rate of inflation. Over the long term, a higher spending rate will produce a lower spending amount because the endowment�s ability to grow has been compromised by the higher spending rate. The effect the distribution (spending) rate has on the dollar payout is shown graphically in (Figure K).

Click to print charts in this section using PDF format
OPERATIONS
10. How and when are LTF units purchased and redeemed?
Units are purchased on quarterly buy-in dates of March 1, June 1, September 1, and December 1. Funds wired to UTIMCO prior to a quarterly purchase date are immediately invested in a money market account until LTF units can be purchased. Interest earned on the money market account during the interim period is distributed to the UT System institution of record.

Click to print charts in this section using PDF format
11. What are the expenses of the GEF and LTF?
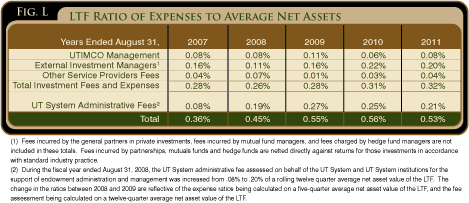
UTIMCO�s large asset base allows for economies of scale in the management of the endowment funds. UTIMCO incurs expenses associated with strategy and analysis, portfolio management, custody and safekeeping, accounting and other investment related functions. The GEF was created as the investment vehicle in which the LTF and PHF could get cost effective exposure to a well diversified investment portfolio. Both the LTF and PHF pay the same fee for every unit of GEF owned by these Funds. However, there are additional expenses which differ for the LTF and PHF. Therefore, the total fee paid by each unit of the LTF includes LTF expenses plus a portion of the GEF expenses. The UTIMCO fee for 2011 fiscal year was 0.08% of LTF average net assets; fees and expenses paid to external managers (which do not directly net fees against the net asset value or capital), and other service providers totaled 0.24% of LTF average net assets. These fees and expenses do not include fees incurred and charged by the general partners in partnership investments, fees charged by mutual fund managers, and fees charged by hedge fund managers as these types of fees are netted directly against returns for those investments in accordance with standard industry practice.
The LTF is also assessed an annual administrative fee on behalf of the UT System and UT System institutions for the support of endowment administration and management, and an annual fee to cover costs associated with UT System personnel in their oversight responsibilities of UTIMCO. The endowment management and administration and oversight fees for 2011 were 0.21% of LTF average net assets.
12. How does compensation for UTIMCO staff members compare to other endowments?
Compensation for top UTIMCO staff members is a combination of base salary and performance-based incentive compensation. Base salaries are set at the median level for similar job functions in a universe of endowments, foundations, and private investment management firms constructed by our compensation consultant, Mercer. Performance-based incentive compensation is based on investment performance and qualitative performance goals. Investment performance includes UTIMCO�s performance and asset class performance. UTIMCO�s investment performance is measured by comparing the endowment funds� (the PUF and the GEF) and the Intermediate Term Fund�s net investment return relative to their respective policy portfolio returns. Asset class performance is measured by comparing asset class net investment returns relative to approved performance indices for each staff member�s specific area of responsibility. Qualitative performance goals may be based on leadership, implementation of operational goals, management of key strategic projects, and effective utilization of human and financial resources. All elements of staff compensation at UTIMCO are defined in the UTIMCO Compensation Program that was approved by the UTIMCO Board and the UT Board.
13. What types of reporting and services are available to obtain periodic information about the Fund?
UTIMCO provides a variety of reports and services, including an annual report. Individual donor statements are available to UT System institutions via UTIMCO�s website at www.utimco.org. UT System institutions may also obtain daily individual account information via the Component Reporting Information System (CRIS), also accessed through the UTIMCO website.
Frequently Used Terms
Asset Allocation � Asset allocation is the long-term strategy for investing funds into various asset classes based on investment goals, time horizon, and risk tolerance. It is the primary determinant of investment return, and is defined by the investment policy for each fund.
Asset Class � Asset class refers to a set of related investment vehicles that have similar risk and return characteristics. Different types of asset classes would include domestic equities, international equities, fixed income, hedge funds, commodities, and private investments.
Benchmark Returns � Benchmark returns are the returns for a specific index defined in the investment policy statement as the performance measurement standard for a particular asset class. The most commonly used benchmarks are market indexes such as the S&P 500 Index for common stocks and the Barclay�s Capital Aggregate Bond Index for bonds.
Book Value of an Endowment � The book value of an endowment represents all contributions, reinvested income and any realized gains or losses attributable to the sale of an investment held in the endowment.
Downside Risk � A risk metric that distinguishes between �good� and �bad� returns by assigning risk only to those returns below a return specified by an investor. Downside risk is considered a more effective risk measure than standard deviation (volatility) for two important reasons: 1) it is investor specific, and 2) it identifies return distributions that have higher probabilities for negative (�left tail�) market events. Downside risk is also referred to as downside deviation or target semi-deviation.
Endowment Policy Portfolio � The endowment policy portfolio is the hypothetical portfolio consisting of each asset category weighted at the neutral asset class allocation outlined in the investment policy of each fund.
Endowment Policy Portfolio Return � The endowment policy portfolio return is the benchmark return for the endowment policy portfolio and is calculated by summing the neutrally weighted index return (percentage weight for the asset class multiplied by the benchmark return for the asset class) for the various asset classes in the endowment portfolio for the period.
Expected Returns � Expected returns are best estimates of what returns might be over some future time period. Expected returns are based on projection models of different possible scenarios. Each scenario is assigned a probability of occurrence. The result of weighting each scenario by its probability of occurrence is the expected return.
Expected Risk � Expected risk is the projected variability in future returns. A common measure of risk is standard deviation.
Hedge Funds � Hedge fund investments are broadly defined to include non-traditional investment strategies whereby the majority of the underlying securities are traded on public exchanges or are otherwise readily marketable. These types of investments can include: (1) global long/short strategies that attempt to exploit profits from security selection skills by taking long positions in securities that are expected to advance and short positions in securities where returns are expected to lag or decline; (2) arbitrage strategies which attempt to exploit pricing discrepancies between closely related securities, utilizing a variety of different tactics; and (3) event driven strategies that attempt to exploit pricing discrepancies that often exist during discreet events such as bankruptcies, mergers, takeovers, spin-offs and recapitalizations in equity and debt securities.
Investment Return � Investment return is the change in investment value during the period, including both realized and unrealized capital appreciation and income, expressed as a percentage of the market value at the beginning of the period. Investment return is also known as total return.
Less Correlated and Constrained Investments � Less correlated and constrained investments are investment mandates that exhibit lower levels of beta exposure to the underlying assets being traded, may be across Asset Classes, may have higher levels of short exposure and leverage, may not have underlying security transparency, are more likely to be in publicly traded securities and may entail lock-ups
Long Position � A long position is a bet that prices will rise. For example, you have a long position when you buy a stock and benefit from prices rising. A long position is the opposite of a short position.
Market Value � Market value is the value of an investment determined by prevailing prices for that investment in an actively traded market including the investment.
More Correlated and Constrained � More correlated and constrained investments are investment mandates that exhibit higher levels of beta exposure to the underlying assets being traded, tend to be in a single asset class, have lower levels of short exposure and leverage, have more underlying security transparency, are more likely to be in publicly traded securities and are less likely to entail lock-ups.
Net Investment Return � Net investment return is total return after deduction of investment management fees and expenses.
Private Investments � Private investments consist of investments in the equity securities of private businesses including real estate. Private investments are held either through limited partnerships or as direct ownership interests. The private equity category also includes mezzanine and opportunistic investments.
Purchasing Power � The primary objective of the endowment funds is to preserve the purchasing power of the endowment over the long-term. This essentially means to increase the market value of the endowments over time by at a rate at least equal to the rate of inflation after all expenses and distributions and to increase annual distributions at a rate at least equal to the rate of inflation.
Realized Gain or Loss � Realized gain or loss represents any gain or loss attributable to the sale or disposition of an investment.
Short position � A short position is a bet that prices will fall. For example, a short position in a stock will benefit from the stock price falling. Short positions are obtained by borrowing securities from another party, selling them and then repurchasing them at a later date, at a lower price, to return the shares to the original owner. The investor making the short sale pockets the difference between the price at which the shares were sold and the price at which the shares were repurchased to return to the original owner. A short position is the opposite of a long position.
Standard Deviation � Standard deviation is a measure of the variability of investment returns. It is the most commonly used measure of risk.
Total Return � Total return is the change in investment value during the period, including both realized and unrealized capital appreciation and income, expressed as a percentage of the market value at the beginning of the period. Total return is also known as investment return.
Unrealized Gain or Loss � Unrealized gain or loss represents the difference between the market value and book value of an investment.
Value-Added � Value-added is a measure of the increase in dollar value of endowment funds due to actual investment performance exceeding the performance of the policy portfolio.
Sample Donor Report


Click to print charts in this section using PDF format