and New Orleans was almost obliterated... but,
seemingly nothing could impede the continuing progress of the latest global bull market run.
In fact, looking at the results of the fiscal year, it is easy to tick off good result after good result with nary a trace of concern. The S&P 500, up 12.6%, well above the 10.4% long run average, and Russell Mid and Small Cap indices up over 27.5% and 23.1% respectively, are key examples of what the U.S. equity markets accomplished in fiscal year 2005. Overseas, international equity markets kept up their part of the bargain, as developed international markets and emerging markets equities pulled off respective returns of 23.6% and 42.0% over the same period. In fact, the emerging markets completed a remarkable run, an annualized rate of 30.0% over the prior three year period. Even REITs, which had put on an impressive multi-year showing before 2005, returned in excess of 25% in 2005, propelling the three year asset class return average to 25.0% annualized.
In general, this was a year in which the more risk one took, the greater was the reward. Witness fixed income, where the standard Lehman Aggregate benchmark index was up a respectable 4.15% in a year peppered with Federal Reserve interest rate hikes. However, High Yield and Emerging Market debt securities, which typically weaken as monetary conditions tighten, turned in results of 9.35% and 13.98%, respectively. In sum, all appeared to go as even the most optimistic of bull market devotees could have hoped.
However, when taking a look at the timeline of the market's advance for the year, three distinct performance periods emerged.
The first is the period from September 1 through October 22, 2004, during which oil prices rose from $44 to $55/barrel - reaching a then all-time high, stoking renewed concerns about inflation, - or even potential stagflation (inflation coupled with little economic growth). Combined with the uncertainty over rising interest rates and the pending U.S. presidential election, a near term bout of market indecision ensued, resulting in low returns across most markets.
The second period covered October 23 through December 31, 2004. During this period, oil retreated from its highs back down to near fiscal year starting levels of $44/barrel. In addition, investors were relieved to find a clear cut winner of the U.S. presidential election, and took the opportunity to express their continued domestic and global economic confidence by pushing most equities markets higher.
The third period covered January 1, 2005, through August 31, 2005, and was a decidedly bipolar environment. On the negative side, concerns over an economic soft patch, the continuing rise in interest rates, and the specter of a housing bubble in the U.S., were counterpoints to the positive, real news of continued economic strength, interest rates remaining at relatively low levels, and building continuing to thrive.
All the while, however, the price of energy retained its upward momentum, ending the fiscal year at an all-time high of $69/barrel with some assistance from another highly active Atlantic hurricane season. Again, even within this tug-of-war period, investors found plenty of opportunity in the higher risk areas of small cap U.S. stocks, REITs, Emerging Markets equities, and especially energy-related securities.
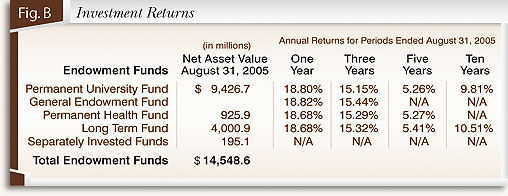
In sum, most investors probably found fiscal 2005 quite satisfying. It might not have been "Much ado about Nothing", but, as in recent years, the big winners were "real" assets such as REITs, Commodities and Emerging Markets. For the endowment funds, the environment was quite challenging, but also very rewarding, as the funds were able to generate double digit results for the third consecutive year, as reflected in Figure B.
Click to print charts in this section using PDF format
Portfolio returns are derived from the marketable and the non-marketable investments asset categories of the portfolios.
Marketable assets. For the year, UTIMCO's marketable endowment assets enjoyed a return of 17.66% for the PUF and 17.79% for the GEF, well ahead of the benchmark return of 14.54%, resulting in a net value-added to the endowments of approximately $325 million.
UTIMCO's public marketable asset classes held a steady hand throughout fiscal year 2005. Overweights in REITs, Commodities and International Equities were standard fare. Within equities, overweights to energy and technology were matched with an underweight to financials. Other than energy, in which the endowment funds were already overweight, there seemed to be no other investment 'fat pitches' in 2005. Contrarily, our biggest concern, at year end 2004, was that the specter of rising rates and energy prices could endanger the return of U.S. stocks in the near term. In response to this concern, we initiated an innovative strategy to protect the endowment funds from a sharp decline in U.S. equities. Using publicly traded options, the strategy limits losses in a sharp market decline while capping upside returns as well. However upside returns are capped at return levels well beyond our expected return for equities, so this is one especially attractive tradeoff. As a result of this strategy, overall risk levels in the endowment portfolios were well below policy levels at the end of the fiscal year.

The marketable alternatives portfolio (hedge funds) once again provided a solid return, reaching 13.91% in the fiscal year. Annualized volatility of the portfolio remained low at 3.10%, approximately 38% of the S&P 500 volatility. The portfolio experienced only one down month, posting a modest loss of -0.83% in April coinciding with the downgrade of General Motors debt to junk bond status. Convertible bond managers were hit particularly hard during this period posting the worst loss for this type of hedge fund strategy over the last 15 years. Convertible bond managers saw their GM debt decline in value while their hedge of GM stock rose in value, forcing many convertible arbitrage managers to liquidate holdings to cover their losses. Fortunately, the portfolio's limited exposure to convertible arbitrage and distressed credit buffered this negative impact. During the year $601.1 million of capital additions and $312.6 million in capital withdrawals were made to the marketable alternatives portfolio. With 28 hedge fund managers in the portfolio, we continue to analyze new hedge fund talent and diligently evaluate current managers in the portfolio.
Absolute return hedge fund investments, representing 58% of the marketable alternatives portfolio, primarily include multi-strategy managers focused on arbitrage and event oriented strategies such as recapitalizations, spin-offs, distressed debt and global special situation equities. During the year, our absolute return managers increased their exposure to global special situation equities and reduced their exposures to convertible arbitrage, distressed credit, and merger arbitrage strategies as spreads for these types of strategies continued to remain low and unattractive. The absolute return managers posted a return of 14.26% for the year.
Equity hedge fund investments, representing approximately 42% of the marketable alternatives portfolio, include U.S. and global long/short equity managers dedicated to exploiting profits from stock selection skills by taking long and short positions in various equity securities. Our global (ex-U.S.) allocation to long/short equity managers increased steadily during the year due to both our existing managers discovering more international opportunities and our additions of capital to global equity managers. As a group, the equity hedge investments posted a return of 13.23% for the year.
Non-marketable assets. The endowment funds' non-marketable assets consist primarily of venture capital and buyout funds. For the second straight year, the non-marketable portfolio generated impressive returns on both absolute and relative bases. On an absolute basis, the PUF and GEF portfolios produced time-weighted returns of 30.00% and 28.26%, respectively. For the second straight year, the endowments benefited greatly from a strong debt market which continued to fuel mergers and acquisitions activity. As a result, UTIMCO's U.S. and European buyout funds were able to sell many of their portfolio companies at significant profits and return cash to the endowment funds. As in 2004, UTIMCO's venture capital funds generated modest returns in 2005. The endowments' managers continued to invest in and develop companies based on exciting new technologies, but the capital markets did not allow for many exits of venture-backed companies. The UTIMCO staff has high expectations for the endowments' venture capital portfolio, but acknowledges that stated returns will not improve dramatically until the initial public offering (IPO) markets improve for venture-backed companies. If the IPO window opens for venture-backed companies, returns can increase substantially in a short amount of time.
In addition to producing positive returns for the year, UTIMCO's private equity funds also produced a record amount of cash for the endowments. Specifically, UTIMCO's general partners distributed $516.5 million in cash and securities to the PUF and GEF, combined, during fiscal year 2005. As a result of those distributions and the overall growth of the PUF and GEF portfolios, the endowments' combined exposure to private equity investments was 9.6% of total assets, significantly below the 15.0% target for this category. To increase the endowments' exposure to private equity, the Non-Marketable Alternative staff committed $555 million to new venture capital, distressed debt, and buyout funds during the year. At year end, the staff managed a portfolio that included 146 limited partnerships that were, in turn, managed by 88 different general partners.
As outlined earlier, the private market investments generated solid absolute and relative performance in the fiscal year. UTIMCO compares the time-weighted returns on the PUF and GEF portfolios to the time-weighted return of the Venture Economics benchmark. For the year ending August 31, 2005, the PUF (+30.00%) and GEF (+28.26) significantly out-performed the Venture Economics benchmark, which returned only 17.7% for that same period. We also assess the relative performance of the portfolio by comparing actual since inception returns (IRR) to the returns the endowments would have earned had they invested their private equity dollars in the public markets. As of August 31, 2005, the endowments' since inception IRR was 11.7%, up from 10.2% a year earlier. Had the endowments invested all of their private equity dollars into the Russell 3000 benchmark, the annualized return over more than two decades would have been only 5.7%. As a result, UTIMCO's private equity investments have produced 6.0% per year in incremental returns for the endowments since inception in 1983 which results in a cumulative value-added of more than $700 million.