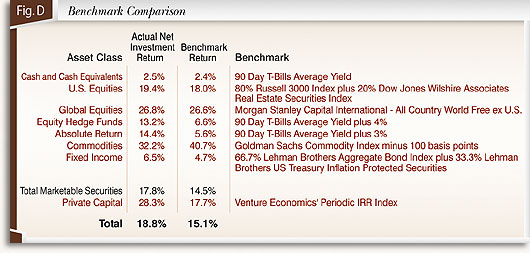
The LTF posted a net investment return of 18.7% for the year ended August 31, 2005. The LTF derives its return mainly from the shares it owns in the GEF. The LTF's return is slightly less than the GEF's return due to additional expenses incurred by the LTF. The GEF posted a net investment return of 18.8%. All asset categories of the GEF posted positive returns for the year, with the commodity (+32.2%), private capital (+28.3%), and international equity (+26.8%) asset categories leading the strong relative and absolute returns across the overall portfolio.
Shakespeare might best describe Fiscal 2005 as "Much ado about Nothing". Yes, there were
and New Orleans was almost obliterated... but,
seemingly nothing could impede the continuing progress of the latest global bull market run.
In fact, looking at the results of the year, it is easy to tick off good result after good result with nary a trace of concern. The S&P 500, up 12.6%, well above the 10.4% long run average, and Russell Mid and Small Cap indices up over 27.5% and 23.1%, are key examples of what the U.S. equity markets accomplished in 2005. Overseas, international equity markets kept up their part of the bargain, as developed international markets and emerging markets equities pulled off respective returns of 23.6% and 42.0% over the same period. In fact, the emerging markets completed a remarkable run, an annualized rate of 30.0% over the prior three year period. Even REITs, which had put on an impressive multi-year showing before 2005, returned in excess of 25% in 2005, propelling the three year asset class return average to 25.0% annualized.

In general, this was a year which the more 'risk' an investor elected to take, the greater the reward. Witness fixed income, where the standard Lehman Aggregate benchmark index was up a respectable 4.15% in a year peppered with Federal Reserve interest rate hikes. However, High Yield and Emerging Market debt securities, which typically weaken as monetary conditions tighten, turned in results of 9.35% and 13.98%, respectively. In sum, all appeared to go as even the most optimistic of bull market devotees could have hoped.
However, when taking a look at the timeline of the market's advance for the year, three distinct performance periods emerged.
The first is the period from September 1 through October 22, 2004 during which oil prices rose from $44 to $55/barrel - reaching a then all-time high, stoking renewed concerns about inflation - or even potential stagflation (inflation coupled with little economic growth). Combined with the uncertainty over rising interest rates and the pending U.S. presidential election, a near term bout of market indecision ensued, resulting in low returns across most markets.
The second period covered October 23 through December 31, 2004. During this period, oil retreated from its highs back down to near fiscal year starting levels of $44/barrel. In addition, investors were relieved to find a clear cut winner of the U.S. presidential election, and took the opportunity to express their continued domestic and global economic confidence by pushing most equities markets higher.
The third period covered January 1, 2005, through August 31, 2005, and was a decidedly bipolar environment. On the negative side, concerns over an economic soft patch, the continuing rise in interest rates, and the specter of a housing bubble in the U.S., were counterpoints to the positive real news of continued economic strength, interest rates remaining at relatively low levels, and building continuing to thrive.
All the while, however, the price of energy retained its upward momentum, ending the fiscal year at an all-time high of $69/barrel with some assistance from another highly active Atlantic hurricane season. Again, even within this tug-of-war period, investors found plenty of opportunity in the higher risk areas of small cap U.S. stocks, REITs, Emerging Markets equities, and especially energy-related securities.
In sum, most investors probably found fiscal 2005 quite satisfying. It might not have been "Much ado about Nothing", but, as in recent years, the big winners were "real" assets such as REITs, Commodities and Emerging Markets. And, as in the past two years, double digit returns were a likely result. For the GEF, we found the environment quite challenging, but also very rewarding, as the funds were able to generate double digit results for the third consecutive fiscal year.
The marketable endowment assets enjoyed a return of 17.8% - strongly ahead of the benchmark result of 14.5% - resulting in a net value-added to the GEF of more than $116.0 million. Non-marketable assets also posted a double digit return of 28.3% during the year, which greatly exceeded the benchmark of 17.7%, resulting in a net value add to the GEF of $43.2 million. For the year, total value added to the GEF was $159.2 million.
Figure D reports the GEF's investment results by asset class compared to each individual benchmark for the year ended August 31, 2005.
Click to print charts in this section using PDF format